
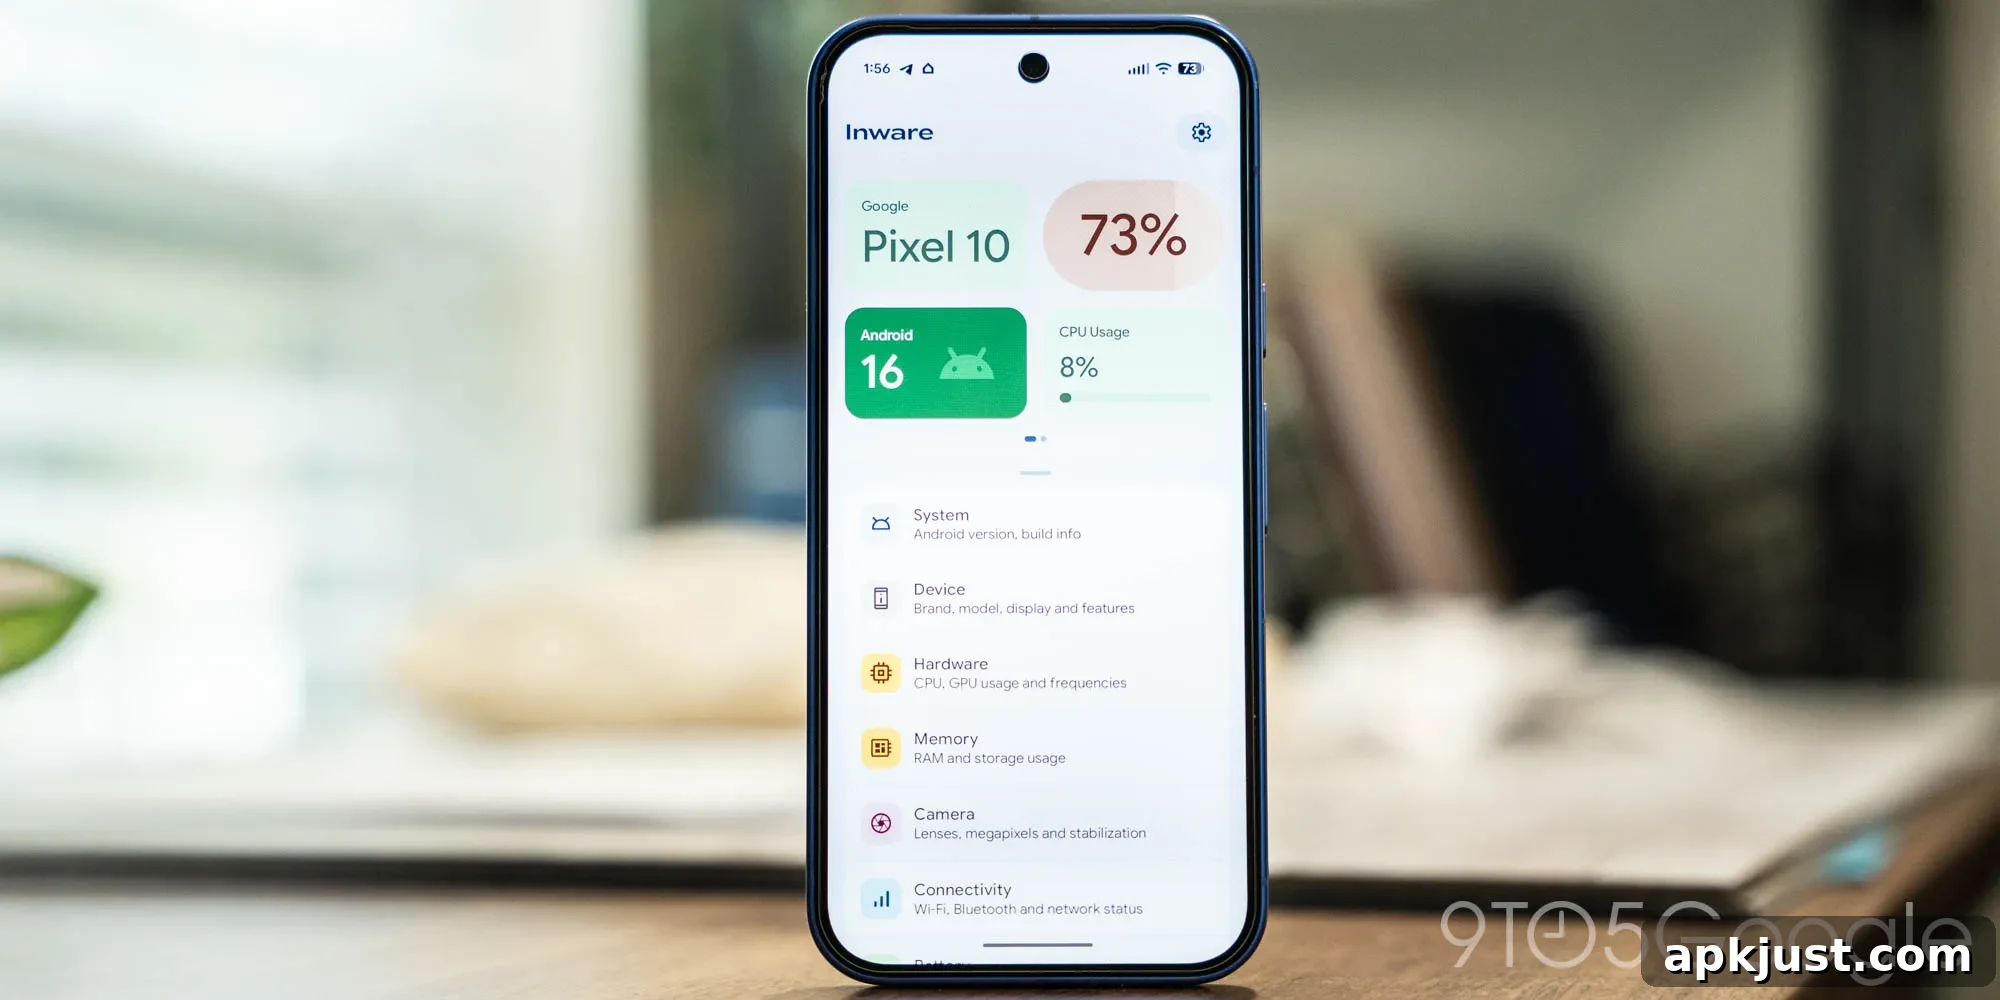
The device information app Inware is receiving a significant update this week. Version 7.0 brings a fresh visual redesign based on Material 3 Expressive, improves readability, and adds several useful diagnostic details for Android users who want to better understand their hardware and system behavior.
Available now on the Play Store at no cost, Inware has long offered a straightforward way to inspect phone and tablet internals. The app surfaces both basic and advanced device data: storage and memory status, processor usage, battery state, and now many deeper hardware and connectivity details that were previously less visible.
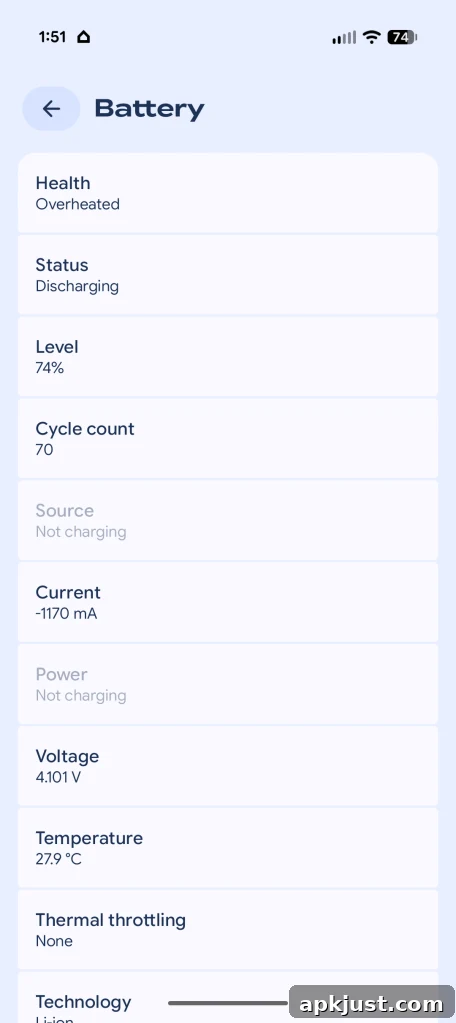
With the 7.0 update, Inware expands the set of metrics it shows. New items now visible in the app include active thermal throttling status, whether your device is using 6GHz Wi‑Fi, Thread network usage, and a battery cycle count. These additions make it easier to monitor device health and diagnose issues such as sustained thermal load, connectivity limitations, or battery wear over time.
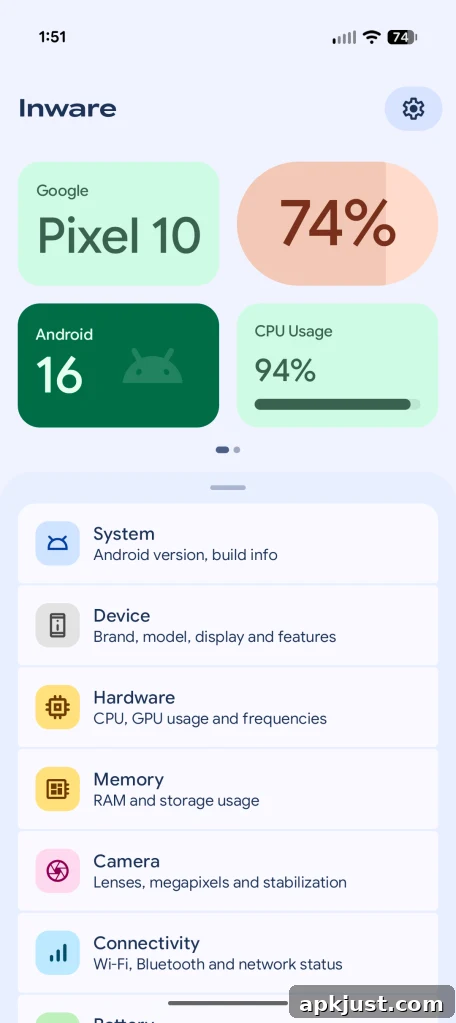
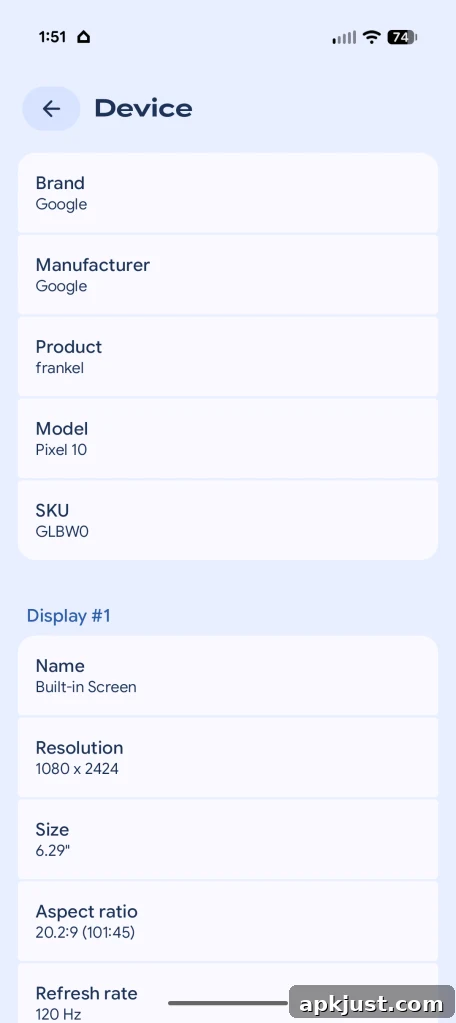
The update also overhauls the app’s layout. The top of the app now features a concise row of tiles that highlight essential information like battery level, current CPU usage, and the device model. Below those quick-glance tiles, the app organizes the remaining data into clearly labeled sections and menus. This arrangement aims to reduce clutter and make it faster to find the information you need without wading through dense lists.
Visually, the redesign embraces Material 3 Expressive principles, emphasizing cleaner surfaces, updated color and spacing, and improved typographic hierarchy. The developer has adopted the Google Sans Flex font throughout the interface to improve legibility and consistency across different screen sizes and display densities. Animations have also been refined to make transitions feel smoother and more responsive while navigating through details and menus.
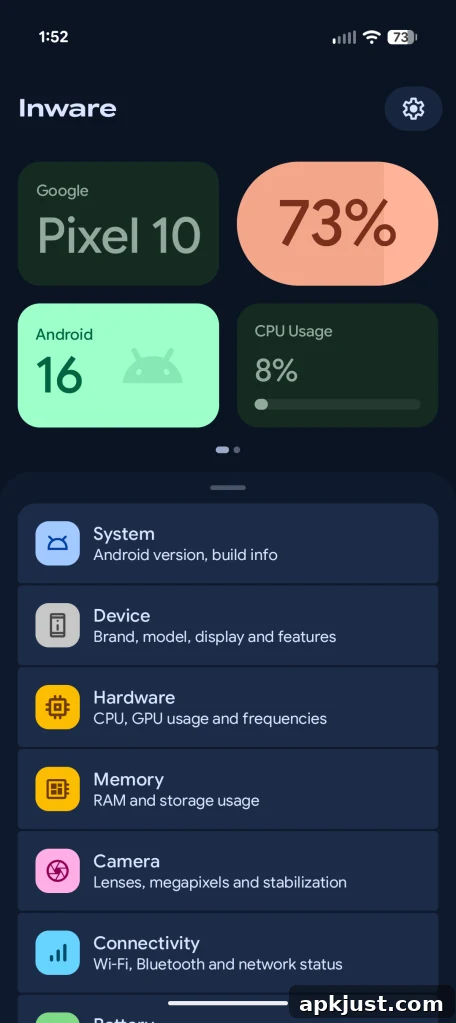
Beyond visual polish and new metrics, this release also includes updated language translations and a number of bug fixes. The developer describes the app as having been “rewired top to bottom,” which suggests structural changes under the hood intended to improve stability, performance, and the app’s ability to gather accurate device information across a wide range of Android builds and OEM customizations.
For users who rely on Inware for troubleshooting, the added data points can be particularly useful. Seeing active thermal throttling indicates whether the system is intentionally slowing down the CPU to manage temperature. The 6GHz Wi‑Fi and Thread indicators clarify which modern wireless features your device supports and is actively using. Battery cycle count delivers a simple measure of battery wear, helping to determine whether a battery replacement might be necessary after prolonged use.
The redesigned tile-first approach also helps casual users who only want a quick overview without navigating every section. Power users and technicians still have access to deeper diagnostics and sensor-level details, but the reorganization aims to present that information in a cleaner, easier-to-navigate way.
If you already use Inware, updating to 7.0 should deliver improved visuals and a broader set of diagnostics. If you haven’t tried the app, the free Play Store release makes it easy to explore what details your Android device can reveal and to keep an eye on system health over time.
Follow Ben: Twitter/X, Threads, Bluesky, and Instagram
Note: Dylan contributes to 9to5Google, but had no input on this coverage.